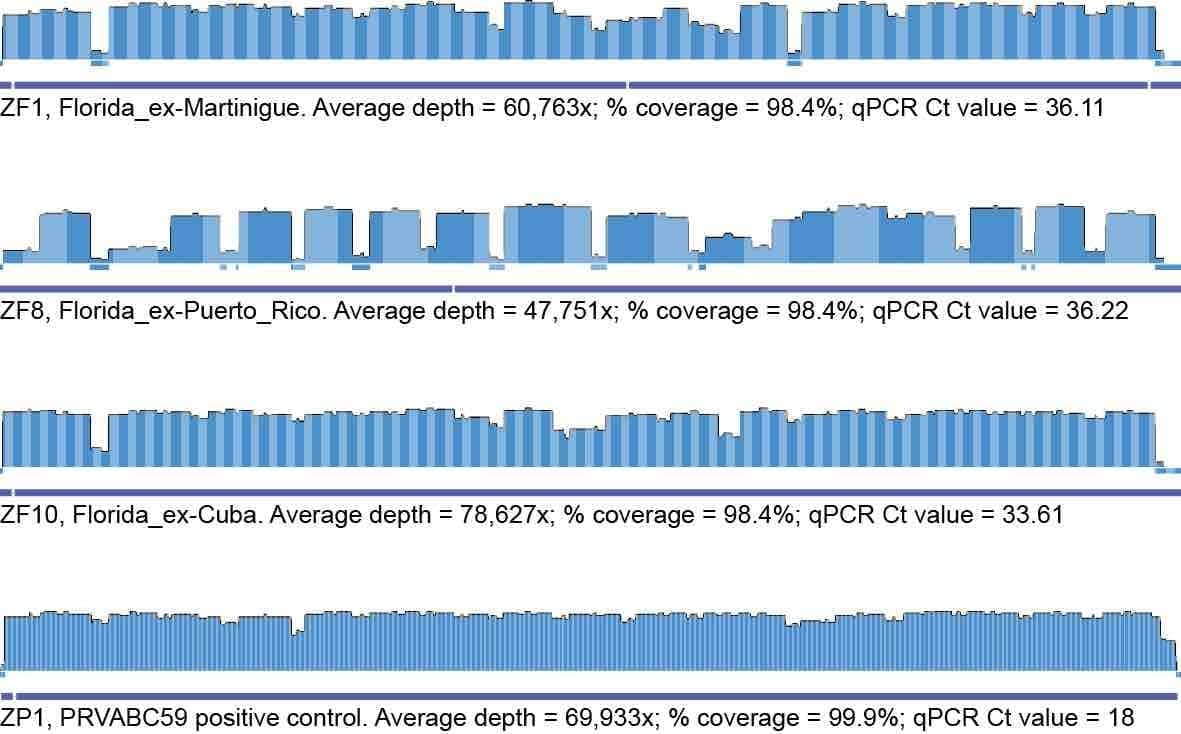
Figure 1. Coverage plots of the included samples.
In a collaboration with Scott Michael and Sharon Isern from Florida Gulf Coast University and Florida Department of Health, we have recently received several travel-related cases detected across Florida. We have now managed to sequence Zika virus genomes from three of these case and the data and analyses can be accessed here.
To successfully sequence these genomes, we used the amplicon-based protocol for Zika virus sequencing developed by Josh Quick and Nick Loman from the ZiBRA project and adopted it for the MiSeq platform (read Nate’s blog post and find the protocol here). Thanks to Pardis Sabeti’s lab at the Broad Institute as well for lots of fun and useful conversations and for working together on figuring out how to get Zika virus sequencing to work!
We are still working through some of the issues with this protocol, and in particular we have encountered the following problems that still need to be worked out:
Unevenness in amplicon pooling
For high coverage samples we see very even coverage of the viral genomes. In lower-coverage samples, however, we see a bias towards amplicon pool 2 so regions covered by pool 1 have lower coverage. We are currently working on fixing this by optimizing the pools and giving them individual barcodes.
Contamination in sequences and in water controls
Our current approach uses single barcodes per sample and we see significant amounts of Zika reads ending up in our negative controls. This issue is likely caused by amplicon contamination during library prep, barcode contamination, and demultiplexing of the reads. We don’t believe these contamination issues influence the two even-coverage Zika genomes we have generated from clinical samples (ZF1 and ZF10), since they have much higher coverages than the negative control and cluster as expected. We believe that ZF8 could have some contamination that we have yet to account for, and at this stage, we cannot fully rule this potential issue out for any of the samples. We are working to resolve this issue and we are hopeful we will have a solution over the next couple of weeks.
Adapter dimers
We see significant amounts of adapter dimers coming through our sequencing run. We are currently addressing this issues with additional SPRI cleanups as part of our library protocol.
We are actively working to address all these issues and our protocol will be updated once we have ironed out some of these problems.
Out of ~ ten samples we have sequenced from Florida, we now have good genomes from three of these. Overall, we observe that using an amplicon-based approach, we can obtain near full-length genomes (Figure 1) from cases with clinically relevant Zika virus genomic loads (i.e. Ct values usually >35). Two of these sequences came from urine and one from saliva – we generally see that these tissue types better for NGS than plasma/serum for Zika virus sequencing.
Samples
ID = ZF1.Sa
Location = Florida_ex-Martinigue
Date = 2016_03_07
Sample type = Saliva
qPCR Ct = 36
ID = ZF8.UR
Location = Florida_ex-Puerto_Rico
Date = 2016_06_13
Sample type = Urine
qPCR Ct = 36
ID = ZF10.UR
Location = Florida_ex-Cuba
Date = 2016_06_02
Sample type = Urine
qPCR Ct = 34
ID = ZP1
Location = Positive control PRVABC59
Sample type = Cultured
qPCR Ct = 18
ID = GN2
Location = Negative control (water)
qPCR Ct = N.D.
Data
All our raw datafiles and analyses can be downloaded here. Files include raw bam files, aligned bam files, quality reports, consensus sequences, trees, etc. Readme file with stats and description of analysis methods can be found here.
Protocol
We based our MiSeq protocol on the protocol developed by Josh Quick and Nick Loman. You can read more here.
Naming scheme for files
ZF10.c1.UR.a1.l1.r1.S4.L001.R1.[machine generated]
Collection Number = For longitudinal samples, the particular draw the sample was obtained from.
Sample Type = UR = urine, SA = saliva.
Aliquot Number = The aliquot number used for sequences – each sample can have multiple aliquots.
Library Number = The library # for this particular sample. Each sample can have multiple independent libraries (‘biological’ replicate).
Run Number = The # this particular library has run. Each library can be run multiple times (‘technical’ replicate).
Preliminary analysis
The three samples add limited information to the global view of the Zika virus pandemic. However, a couple of noteworthy points that we can see from the data:
- To the best of our knowledge, we provide the first sequence from Cuba.
- To the best of our knowledge, these are the first uncultured Zika virus sequences from travel-related cases to Florida.
- The samples cluster as expected, suggesting that the Zika cases did in fact acquire their infections while traveling abroad (as opposed to locally in Florida – Figure 2).
- The data is fairly clock-like (Figure 3), suggesting that a fairly robust clock can be captured from the data once the dataset is significantly larger.
- Focusing only on the Zika virus sequences collected since 2013, we can see that the French Polynesian outbreak roots the tree very well and show the spread from this country to Brazil, and then across South America (with exported cases to e.g. China, Figure 4 and interactive version on NextStrain)
- Again focusing only on the 2013 > sequences, we can see that even within the current outbreak the tree is reasonably clock-like with a tMRCA estimate of late 2012 and an evolutionary rate of ~1E-3 subs/site/year (Figure 5). More robust estimates and a larger sample size should allow us to get greater insights into the , spread, dynamics, and timing of Zika virus during the current outbreak.
Next steps
We are in the process of scaling up sequencing from the Florida area, as well as from several Latin American countries. Our technical focus right now is on optimizing the protocol and create a larger sequence catalog for Zika virus. The protocol is working well at the moment and with a few tweaks we’re confident we’ll be able to scale quickly. We also hope to sequence from locally acquired Zika samples from around the Miami area, so we can get better estimates of timing, dynamics, and migration of this just-beginning epidemic in Florida. From an analysis standpoint, we’re interested in understanding the spread and timing of Zika virus from Africa > Asia > Oceania > South America > North America.
Collaborators
Florida Gulf Coast University
Amanda Tan
Scott Michael
Sharon Isern
Florida Department of Health – Bureau of Public Health Laboratories, Tampa
Marshall Cone
Edgar Kopp
Kelly Hogan
Andrew Cannons
University of Birmingham
Josh Quick
Nick Loman
NextStrain
Trevor Bedford
Richard Neher
Broad Institute
Pardis Sabeti and Crew
Disclaimer
Please note that this data is still based on work in progress and should be considered preliminary. If you intend to include any of these data in publications, please let us know – otherwise please feel free to download and use without restrictions. We have shared this data with the hope that people will download and use it, as well as scrutinize it so we can improve our methods and analyses. Please contact us if you have any questions or comments – we’ll buy beers for #ResearchParasites that spot flaws and faults in the data and come up with improvements! Email us here.
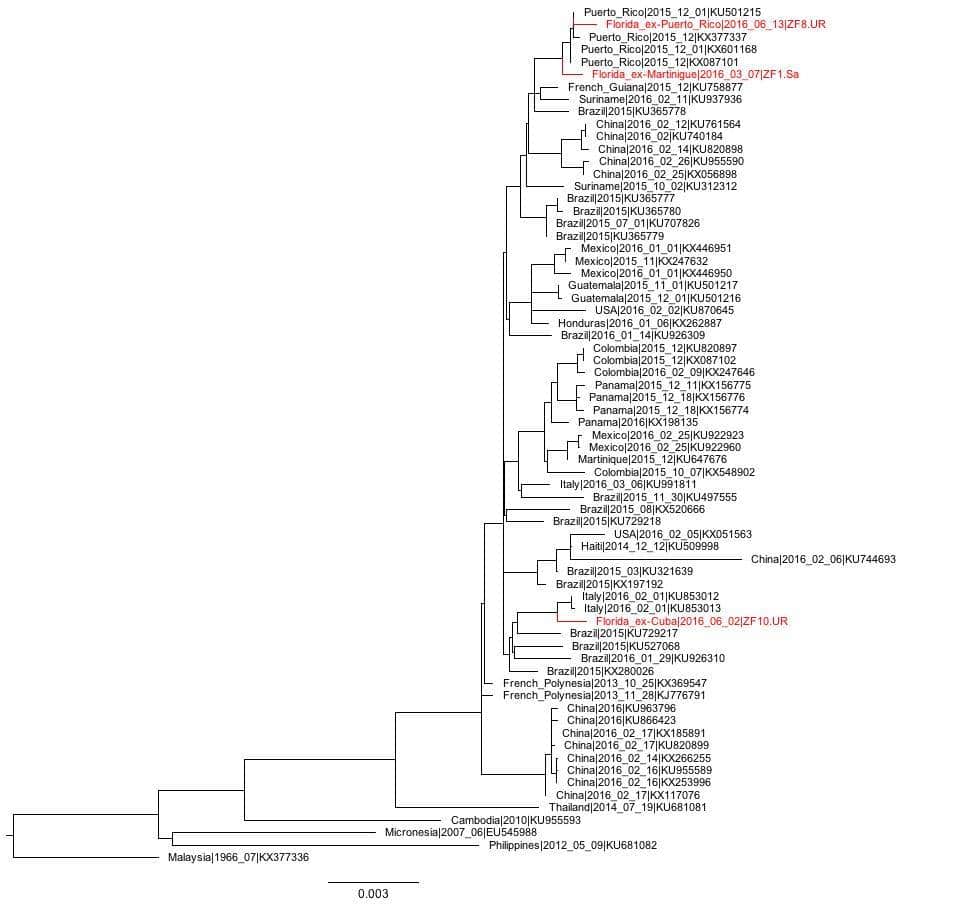
Figure 2. Zika virus tree was created using RAxML. The raw file can be found via the Dropbox link.
![Figure 4. Zika virus tree created using sequences sampled since 2013 (available on NextStrain [http://nextstrain.org/zika/]).](https://andersen-lab.com/wp-content/uploads/2016/08/Zika_align-RAxML-Tree.nex_.jpg)
Figure 4. Zika virus tree created using sequences sampled since 2013 (available on NextStrain).
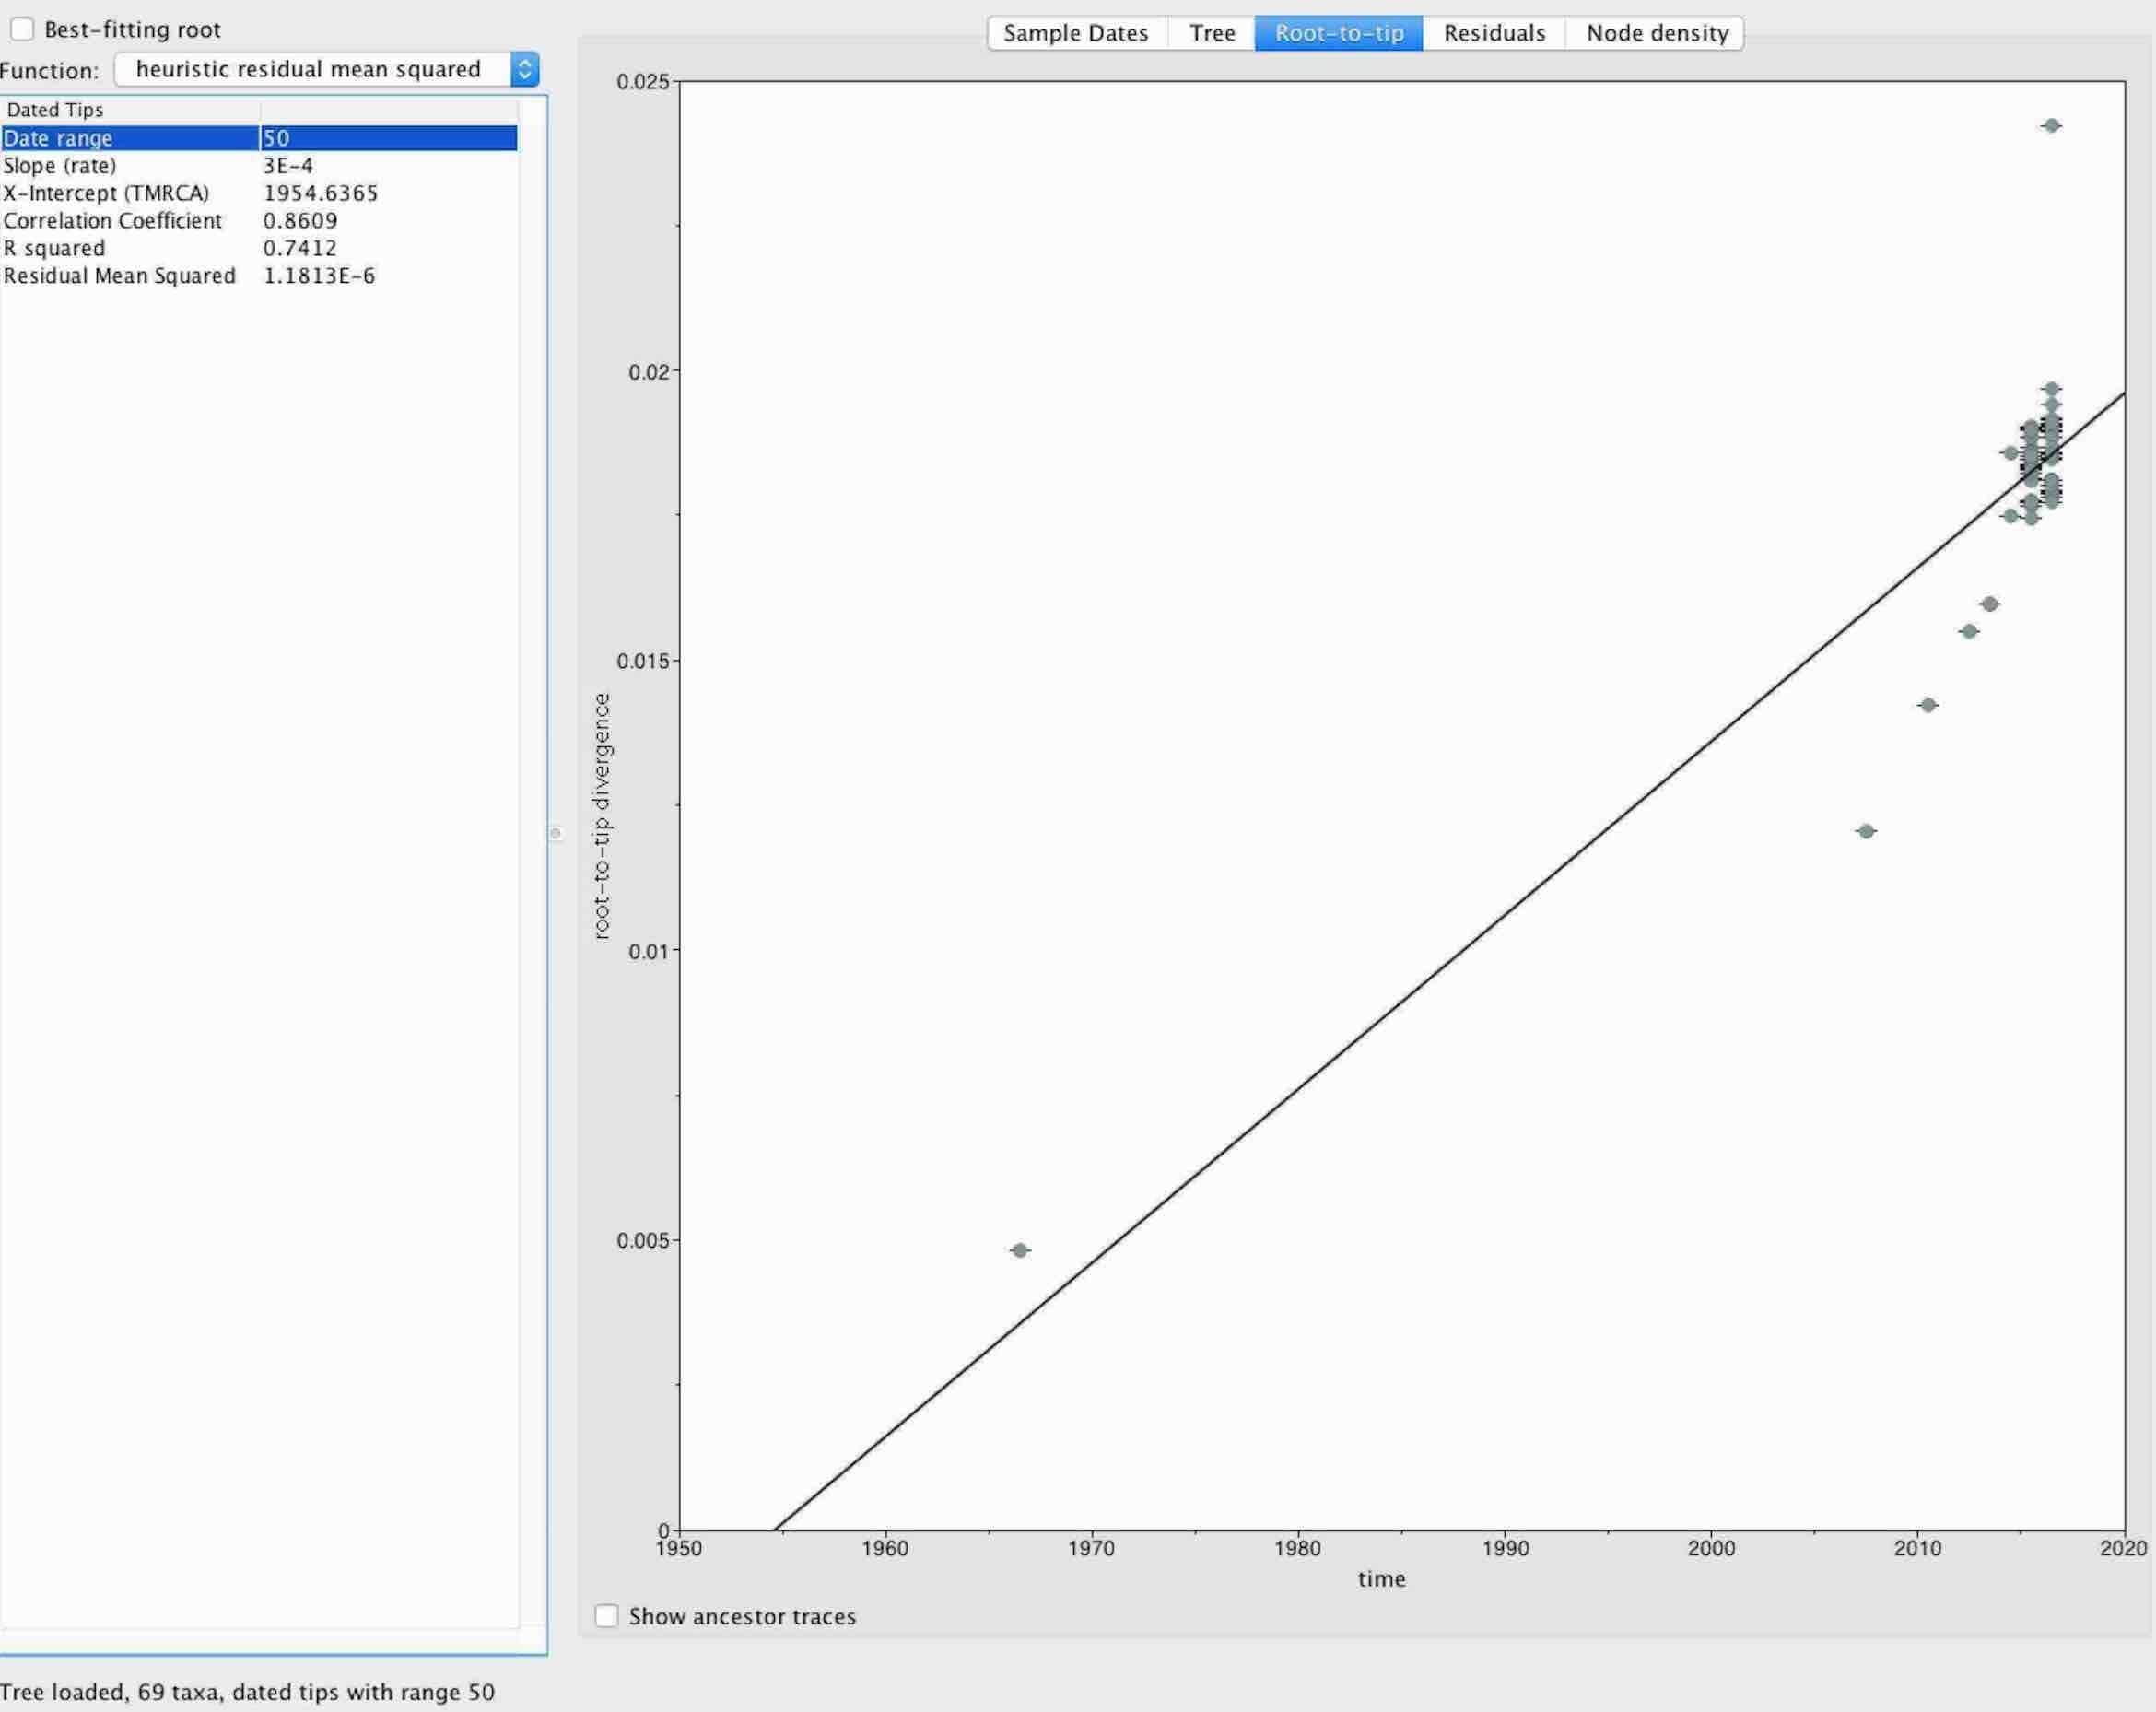
Figure 3. Root-to-tip estimate using TempEst. The tree was rooted on the 1966 Zika virus strain from Malaysia.
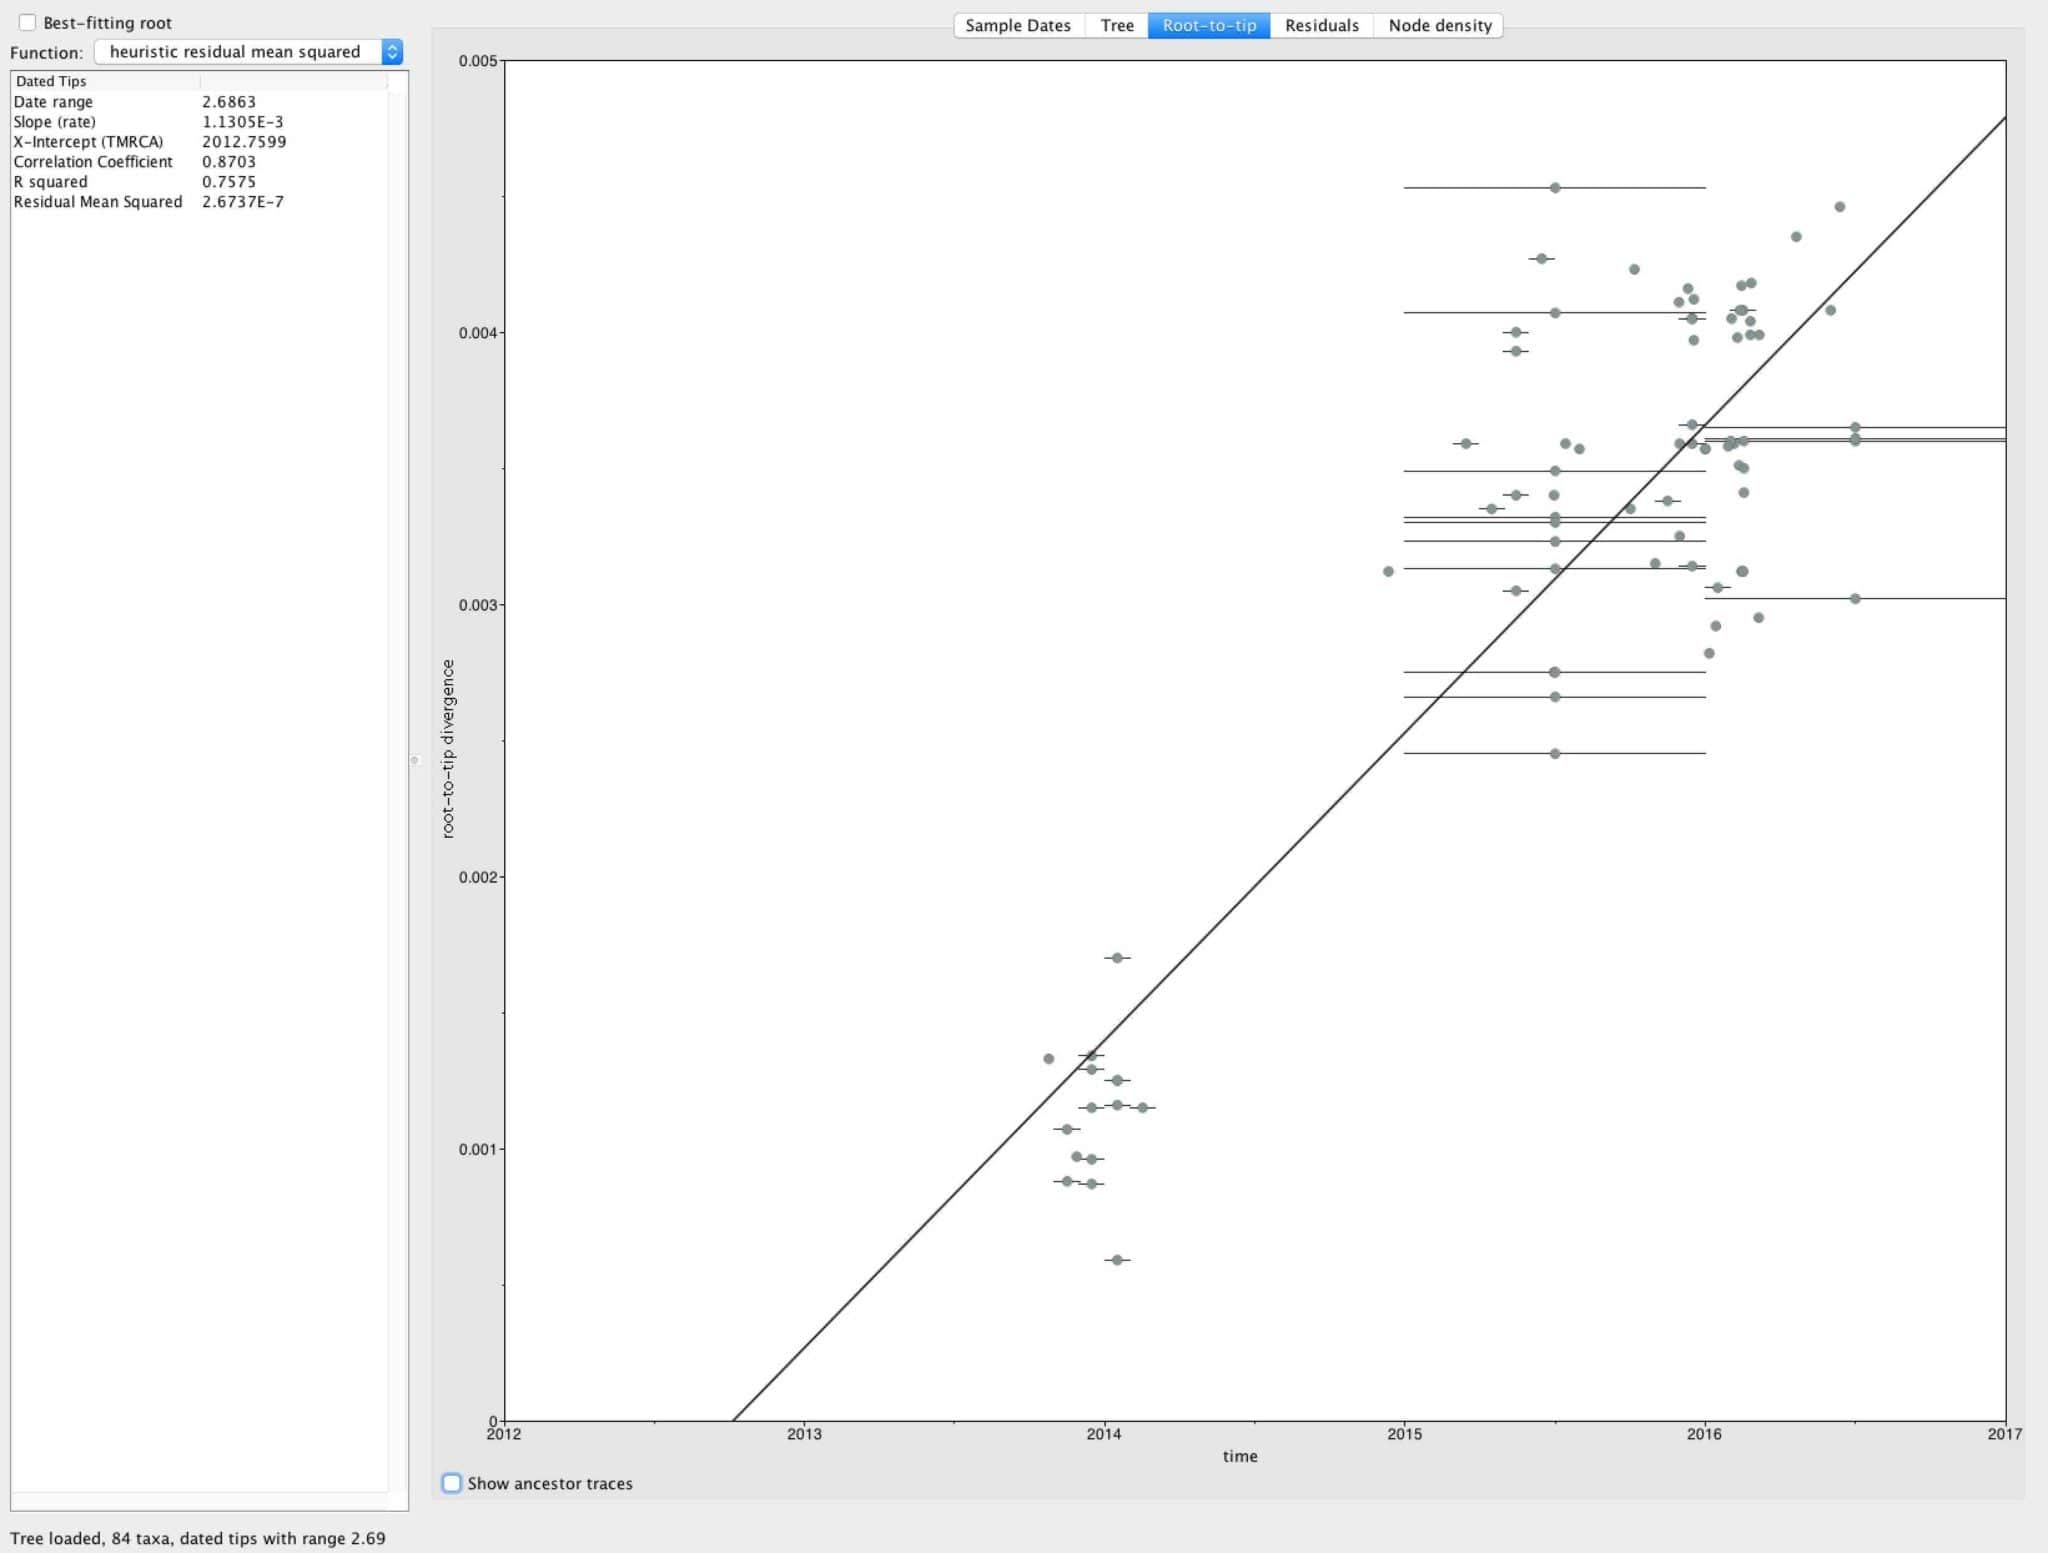
Figure 5. Root-to-tip plot using only the sequences sampled since 2013. The tree was rooted on KX447517 from French Polynesia (Jan. 2014).