

Data here. Permanent Andersen Lab project link is here.
Most epidemiological investigations of Zika virus during the current epidemic in the Americas requires temporal human case data. The only place to gather this information is is from the Pan American Health Organization (PAHO), an arm of the World Health Organization. They present Zika virus case numbers in two ways: spreadsheets of cumulative case counts and bar graphs of weekly reported cases. The data from the cumulative case spreadsheets are easy to download and can be readily adapted for research purposes. Using the differences in cumulative cases reported per week, however, is not the same as obtaining weekly reported case counts. That is mainly because not every country/territory reports Zika case numbers to PAHO every week. In some instances, there could be backlogs of reporting for a month or longer. Therefore, by using this method, artificial peaks and valleys of Zika case numbers appear that will bias epidemiological investigations.
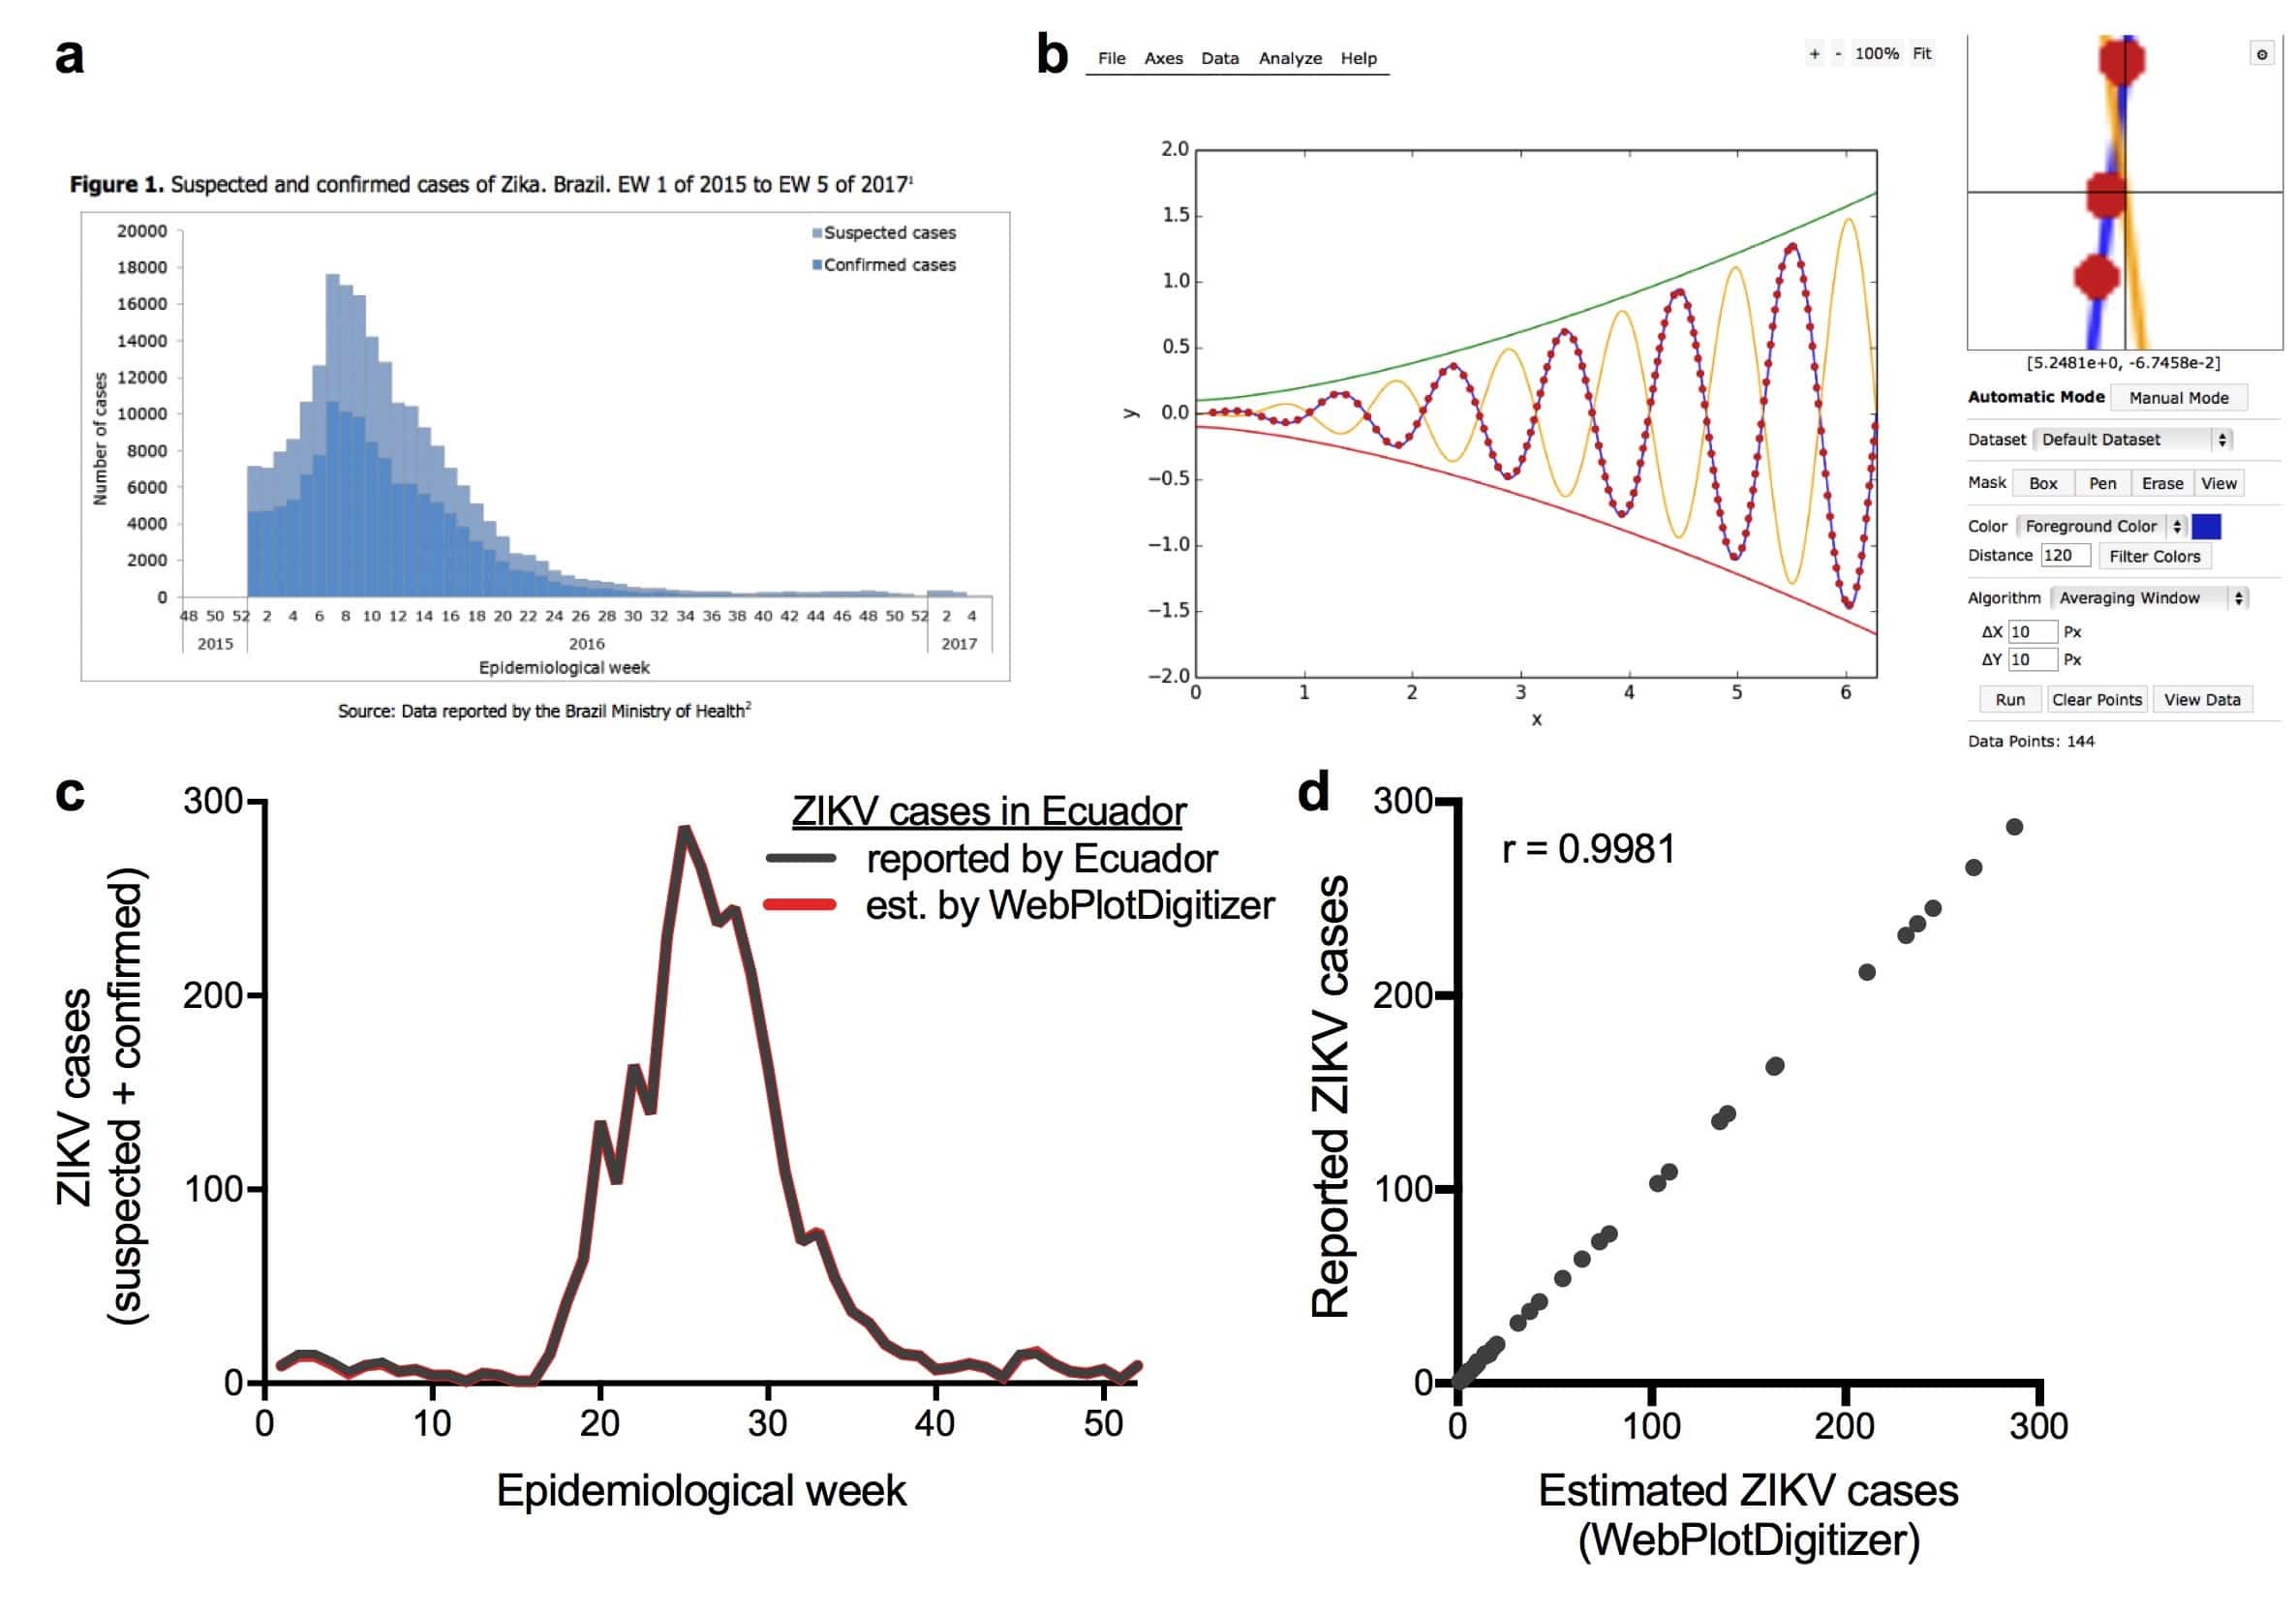
The more accurate weekly data reported by PAHO are presented as bar graphs for each region. Here, PAHO takes the backlogged data and assigns cases to their respective weeks of reporting. This was the data that we needed for our research investigating the spread of Zika virus into Florida. We contacted PAHO several times by phone and email; however, all of our requests were unsuccessful. Initially, study co-first author Jason Ladner used a Web Plot Digitizer to transform the data from plots into numerical values (Figure 1a-b). Data reported from Ecuador included the actual numbers above each plot, allowing us to test the accuracy of the Web Plot Digitizer. The reported and estimated data were highly correlated (r >0.99, Figure 1c-d), indicating that this is an accurate method to obtain the weekly data. After recently publishing the manuscript, we realized that others would also like to use the data. Therefore, we re-analyzed the data available through June 1, 2017 and made it free to use for educational purposes. The data can be found here.
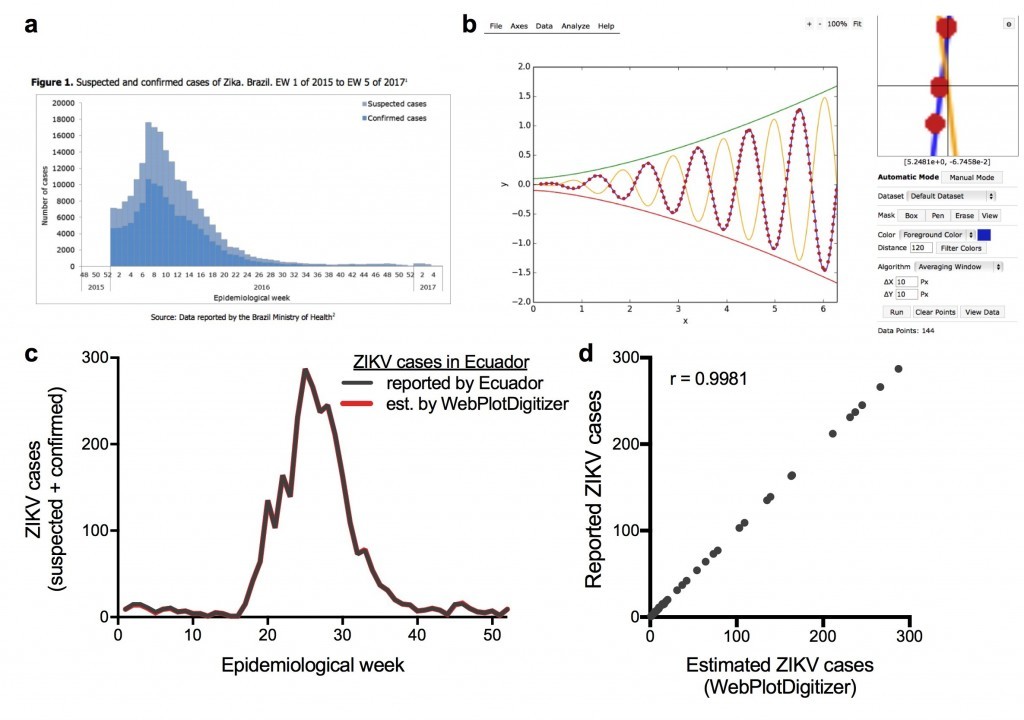
Figure 1. Converting Zika virus case data available as bar graphs into numerical values using Web Plot Digitizer. (a) Figure from the PAHO epidemiological report from Brazil. (b) Example of digitizing plots using the Web Plot Digitizer. (c-d) Validation of our methods, originally shown in Grubaugh et al., 2017.
Methods
Screenshots of the PAHO bar graphs containing Zika virus cases by epidemiological week were taken from 41 countries in the Americas. Each screenshot was manually uploaded into the Web Plot Digitizer and data for Zika virus cases (confirmed and suspected) by epidemiological week was extracted from the graphs. The values acquired from the Web Plot Digitizer were recorded and compiled in three .csv files (Caribbean, South America, Central America) for further analysis. Zika virus incidence was calculated for each of the 41 countries/territories by dividing the total number of Zika virus cases by the total population/100,000.
Summary of results
We graphed the Zika virus cases and incidence rates for each week in 2016 (Figure 2). We found that Brazil had the highest number of reported cases early on in 2016, followed by Colombia and Venezuela. Towards week 30, Puerto Rico experienced a slight spike in cases that soon dwindled off by the end of the year. This shift in trends is most likely due to seasonal changes, given that the summer period is experienced early in the year in South America and mid-year in the Caribbean, and Aedes aegypti mosquito abundance. We found that incidence rates were not dominated by South American countries with the most reported cases, but by islands in the Caribbean. Specifically, Martinique had the highest incidence rates in early 2016, followed by Guadeloupe in mid-2016 and St. Barthelemy in late 2016. This is likely due to the lower human population density and greater mosquito abundance in the tropical Caribbean region. Although the information provided here attempts to encapsulate real-world trends, the data cannot be considered complete given that Zika virus case reporting is likely not equivalent in all parts of the world.
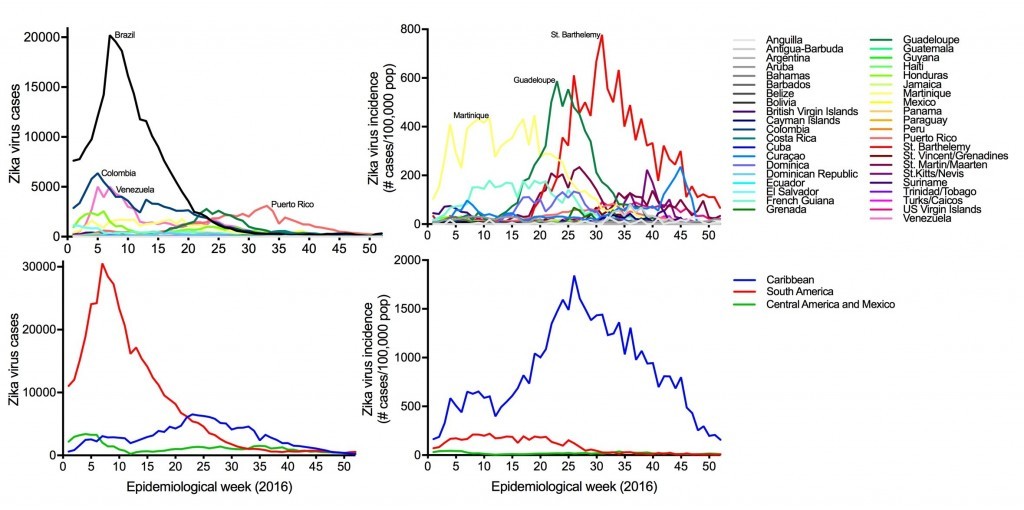
Figure 2: Zika virus cases and incidence rates by epidemiological week for 2016.