To understand the spread of COVID-19 in San Diego, we looked at the age distribution of COVID-19 over time (Figure 1). Data for this analysis was provided by the Epidemiology and Immunization Services Branch of the County of San Diego Health and Human Services agency through the San Diego Open GIS Data Portal. The visualization was inspired by Gytis Dudas’s tweet looking into the age distribution of COVID-19 cases in Lithuania.
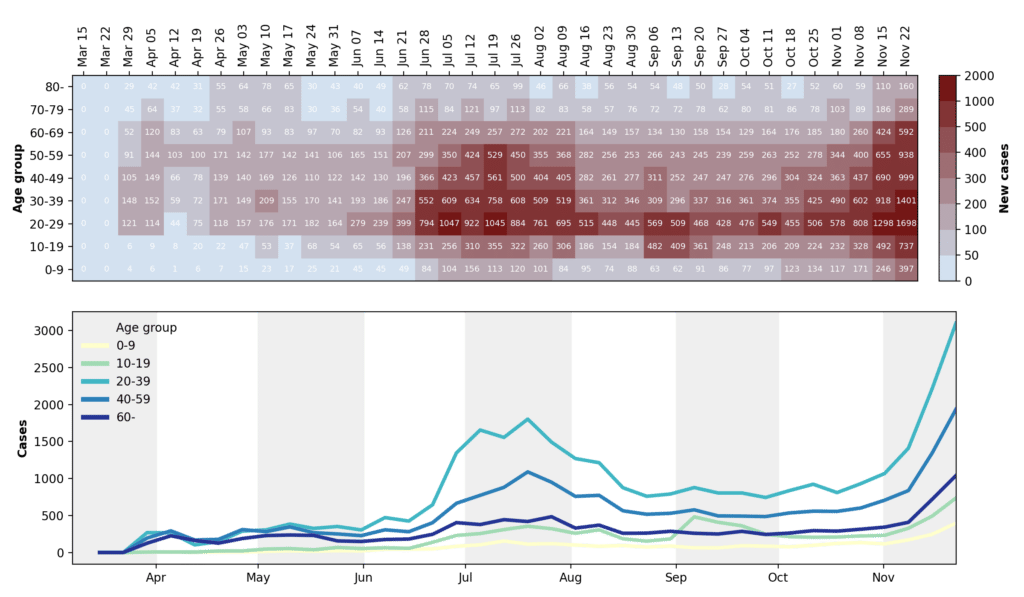
Figure 1: Top. Age distribution of new cases in San Diego county from March to November. Color and value of each box in heatmap indicate the number of new cases reported in the week ending with the date specified. Age stratification of new cases for the first two weeks shown is unavailable, and thus represented as zeroes. Bottom. Same data as in top panel, but with larger age group bins.
We found that cases in the county appear to be spurred by increases in cases in younger age groups, primarily 20-29 year olds. The most prominent increases occurred in June and October and were followed by a similarly large increase in cases in the older age groups after a delay of around one to two weeks. In contrast, cases in Lithuania (see tweet above) were observed at relatively the same time across adult age groups. Differences in risk-taking behavior, school/university reopenings, mask use, social distancing, state-imposed restrictions, and demographics potentially all play a role in explaining the dissimilarity between the two locations.
This trend is not seen in ages younger than 20-29 year olds, whose cases are similar to those reported in older age groups. In one specific situation, they are even independent. Cases in 10-19 year olds increased in September following the start of the Fall semester but were not immediately followed by a significant increase in cases in any of the older age groups. We are still exploring why younger age groups display varying levels of independence relative older age groups. In any case, these observations provides further evidence that infections in younger age groups, particularly 20-29 year olds, should not be ignored, despite being largely asymptomatic, because of their potential to spread to older more susceptible individuals.
